
Analysis of digital filters via SPICE-family programs
Prof.
Dalibor Biolek, Inas Faisel
Abuetwirat
Brno University of Technology, Faculty of
Electrical Engineering and Communication UT Brno
Institute of Microelectronics, Údolní 53, 602 00 Brno, Czech Republic
email: dalibor.biolek@unob.cz
|
The paper describes an unusual approach of employing the SPICE-family circuit simulation programs in a simple analysis of digital filters. For explanation and demonstration, the evaluation version of Micro-Cap 8 is mainly used which is available free on the Internet.
|
Contents
2 Implementation of basic building blocks of digital filters in PSPICE
3 Implementation of basic blocks in Micro-Cap
4 Demonstration of working with new blocks
5 Utilizing special Micro-Cap functions
6 Analysis of quantization noise propagating to the filter output
7 Other possibilities of analysis
The design and subsequent analysis of digital filters is well-supported by MATLAB combined with the Signal Processing Toolbox. In addition, owners of the Filter Design Toolbox can easily include quantization effects into the design. Additional features are enabled by exporting the designed realization structures into Simulink.
However, not everyone can avail themselves of such expensive software tools. That is why the paper is focused on the analysis of digital filters, including quantization effects, via the SPICE-family programs, namely via the evaluation version of Micro-Cap 8, which is freely available. Compared with MATLAB, another advantage is the graphical tool in the form of schematic editor, enabling easy drawing of filter realization structures with subsequent analysis of frequency responses from the input into an arbitrary node of filter structure. This feature is especially desirable for dynamic range optimization and scaling. The filter structure is created by connecting the blocks of delay, coefficient multiplication, and signal summation. The beginner's training and introduction to the schematic editor and subsequent analysis are incomparably faster than courses in MATLAB and its FDATOOL (Filter Design and Analysis Tool).
In conclusion, we show a procedure which enables an analysis of digital filters of orders of hundreds and more, even if the circuits analyzed in the evaluation version of Micro-Cap are limited to 50 components.
2 Implementation of basic building blocks of digital filters in PSPICE
Since the basic circuit variables in the SPICE-family programs are voltages and currents, the summing block, the block of coefficient multiplication, and the block of delay by sampling period Ts = 1/fs can be implemented by controlled sources. For the popular PSPICE program, the E-type controlled source can be applied:
Summing block:
Esum out 0 value={V(in1)+V(in2)}
Block of multiplying by constant A:
Emul out 0 in 0 {A}
Delay block:
Ez out 0 LAPLACE {V(in)} {exp(-s/fs)}
Both constant A, representing a concrete filter coefficient, and sampling frequency fs must be defined as global variables by .param command.
Before the AC analysis of a digital filter compiled from the above blocks its input must be excited by an independent voltage source with the attribute AC = 1. After that, one will observe the frequency dependence of voltages at the outputs of appropriate blocks.
It is possible to model the above blocks as SPICE subcircuits and to assign them schematic symbols, for instance in the currently used OrCadPSpice 10. We get a powerful tool for digital filter analysis, but without any opportunity of modeling the quantization effects.
One possible form of simple PSPICE library is below:
|
PSPICE library for digital filter analysis *summing block .subckt sum in1 in2 out Esum out 0 value={V(in1)+V(in2)} .ends
* multiplier .subckt mul in out params: A=1 Emul out 0 in 0 {A} .ends
*delay block *this subcircuit uses global parameter fs *which MUST be defined in circuit file .subckt delay in out Ez out 0 LAPLACE {V(in)} {exp(-s/fs)} Raux out 0 1T .ends
|
Another method of implementing these models into the OrCadCapture schematic editor is a proper definition of a PSPICE template for the schematic symbol of each part.
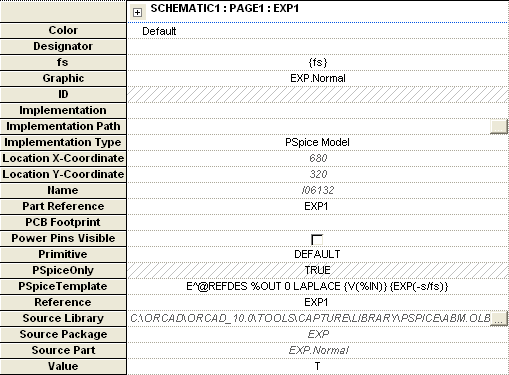
Fig. 1 demonstrates the implementation of a simple digital filter into OrCadCapture. Schematic symbols from the standard *.olb libraries, namely SUM, BUF, EXP, were assigned to the summation, constant multiplication, and delay blocks. The definition of PSPICE templates is obvious from Figs 2 a, b, and c. The sampling frequency is defined by global variable fs. The resulting frequency responses are in Fig. 3.

Fig. 1. Example of implementation of band-reject 2nd-order digital filter for suppressing 50Hz interference.
|
|
(a) |
|
|
(b) |
 |
(c) |
Fig. 2. Attribute window of the blocks of (a) summator, (b) constant multiplication, (c) delay.

Fig. 3. Demonstration of AC analysis of the filter in Fig. 1.
Practical filter implementation requires representing the quantization of filter coefficients. It is a serious problem in PSPICE to program rounding the coefficients to a given number of bits in fixed-point representation, because the PSPICE language does not contain proper algebraic functions such as the ROUND, CEIL, FIX, FLOOR functions in Matlab. There is yet another drawback: the installation files of current student's version of OrCadPSpice 10 exceed 180MB. Taking also into account that this program is too cumbersome and not user-friendly, especially for beginners and inexperienced users, it is useful to look round for another program.
Starting with version 8, the Micro-Cap program has implemented - in addition to all PSPICE and SPICE3 functions - a set of new functions, which were surely not implemented into the simulator for digital filter analysis. However, we utilize them - among other things - for elegant modeling of quantization effects. Compared with OrCadPSpice, this powerful program is user-friendly and its installation software, which occupies only 14MB, can be downloaded from [2]. The implementation of macros for modeling digital filters is easy, as described in the following Chapter.
3 Implementation of basic blocks in Micro-Cap
Micro-Cap enables two methods of including new blocks: either by means of SPICE subcircuits or with the utilization of macros.
When working on the level of schematic editor, the first method means the following operations:
1 We create a file x.lib with SPICE library of new blocks, and copy it to the Micro-Cap folder Library.
2 We add the library name in the list of libraries into the file nom.lib.
3 By means of the „Shape Editor“, we define the schematic symbols of new blocks, either by selecting some of the existing ones or by creating new symbols.
4 In the „Component Editor“, we put the new blocks into the tree component structure, and we assign them schematic symbols and models.
The procedure utilizing the Micro-Cap macros is similar. The only difference is in the first two steps, which are replaced by the following operations:
1, 2 We create the macros files in the schematic editor and then we copy them into the Micro-Cap folder LIBRARY.
The inclusion of new elements by means of SPICE libraries is a little laboured. However, in terms of user comfort, macros are preferred. That is why the SPICE convention for calling subcircuits with parameters is more cumbersome than calling Micro-Cap macros with parameters. Micro-Cap macros implementation will be described below.
The following text is about an effective method of including models of new elements into Micro-Cap "unearnedly", i.e. by skipping the above items. The only things we must do is to copy three macros *.MAC into Micro-Cap folder LIBRARY, and to read one of the sample circuit files, which includes models of new blocks, into the schematic editor.
 |
 |
(a) |
 |
 |
(b) |
 |
(c)
|
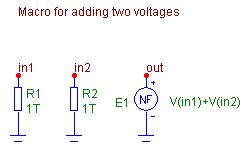
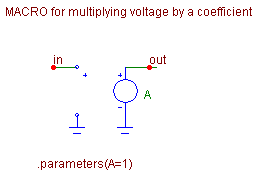
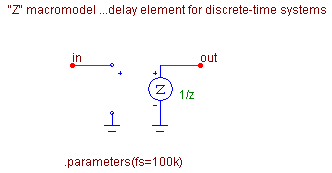
Fig. 4. Macros for modeling (a) summing block - ADD2, (b) multiplier block - MULTI, (c) delay block - Z, and the corresponding schematic symbols.
The macros of basic blocks in Fig. 4 are saved in files ADD2.MAC, MULTI.MAC, and Z.MAC. The files can be downloaded here. After that, copy them into the Micro-Cap folder LIBRARY.
Macro ADD2 uses the Micro-Cap function voltage source of the NFV type, which is an analogy of the PSPICE - type controlled source "E" with the VALUE={}convention. Auxiliary resistors R1 and R2 prevent „floating nodes“ problems for unattached input terminals.
Macro MULTI is a common voltage-controlled voltage source.
The delay block is implemented by a special Micro-Cap element ZVofV. It is a z-domain voltage-controlled voltage source, an analogy of the "Laplace source" in PSPICE. The source parameter is sampling frequency fs. Voltage gain is defined as z -1. This block can be also modeled by the "Laplace source" as shown in Chapter 2.
Macro ADD2 uses the standard Micro-Cap schematic symbol SUM. New schematic symbols named COEF and Z have been created for macros MULTI and Z.
Thanks to the so-called „File portability“ [3], we can work with new macros immediately without importing libraries of schematic symbols and other activities described at the beginning of this chapter. The following demonstration starts from the assumption that the files with macros have already been copied in Micro-Cap folder LIBRARY.
4 Demonstration of working with new blocks
Let us download the circuit file BR.CIR, run Micro-Cap, and read this file into the schematic editor (File/Open). The realization structure of band-reject digital filter appears on the drawing area (see also Fig. 1).

Fig. 5. Modeling the filter from Fig. 1 in Micro-Cap.
The filter coefficients and the sampling frequency are defined by .define statement, which is a Micro-Cap analogy of PSPICE .param statement. The numerical values can be also put directly as element attributes to schematic symbols. However, it is not a preferred method because - appart from the waste of lucidity - we lose the possibility of working subsequently with this data, as shown below.

Fig. 6. After reading the circuit file into schematic editor, the new parts add2, multi, and z are imported into the Component/Import folder.
Double-clicking on the schematic symbols of blocks of multiplication and delay yields their attribute windows, from which one can see the very simple format of defining symbolic parameters a1, b1, b2, and fs.
As shown in Fig. 6, the components add2, multi, and z are available in the folder Component/Import for further work, for instance, for filter extension by more blocks, for creating a new file with similar simulation, etc. It works thanks to the above-mentioned „File Portability“, which means the following: The circuit file contains - among others - also information about the schematic symbols of elements used in the circuit, as well as information about the assignment of element outlets to pins of models of these components. For the components whose libraries are included in the standard installation of Micro-Cap, the information of the first type - about the schematic components - is located in the library of schematic symbols STANDARD.SHP. Information about the connection between schematic symbols and models is in the library of so-called Component Editor. In the evaluation version of Micro-Cap, it is located in the DEMO.CMP file. After reading the circuit file, consisting of new parts outside these libraries, files IMPORT.SHP and IMPORT.CMD are automatically created in the main Micro-Cap directory. In this way, the program creates additional sources of data, which is necessary for full-value work with new circuit elements.
It is also possible to extend - by means of the SHAPE Editor - the current STANDARD.SHP file by new schematic symbols from IMPORT.SHP, and to complement the file DEMO.CMP with information from the file IMPORT.CMD. Then the component libraries for digital filter analysis will be available directly and not vicariously via File Portability. The procedure is simple and it is described in the program manuals [2].
Frequency responses of the filter from Fig. 5 are obtained after running the AC analysis: Analysis/AC.., or by applying the Alt+2 hot-key. A window "AC Analysis Limits" appears as shown in Fig. 7. After pressing Run, the analysis is performed from the frequency 1Hz to fs/2. The amplitude and phase frequency responses are also shown in Fig. 8.

Fig. 7. Example of setting the attribute window for AC analysis of the filter from Fig. 5.
There are apparent differences between phase responses in Fig.8 and Fig. 3. However, they belong to the same filter in Fig. 5 after its analysis by OrCadPSPICE and MicroCap. In fact, the curves are equivalent because the values of phase shifts at frequencies above 50Hz are shifted by 360 degrees.

Fig. 8. Frequency responses of the filter from Fig. 5.
5 Utilizing special Micro-Cap functions
Fig. 9 illustrates the modeling of a band-reject digital IIR filter from the BRq.CIR demonstration file. Interesting effects will be described below by means of .define statement and by the so-called „formula text“ [3].

Fig. 9. Example of utilizing special Micro-Cap features for simple design, visualization of results on the drawing area, and programming the quantization of filter coefficients to N bits.
For the following experiments it is recommended to provide displaying the analysis results, in particular filter coefficients, to as many valid digits as possible. This effect will be attained by selecting the Options/Preferences, and by setting “16 digits decimal” in item “Formula text” in folder Format.
The filter in Fig. 9 is in the 2nd canonical form. If for the time being we specify its coefficients identically as in Fig. 5 as a1, b1, and b2, its transfer function is in the following form:
 |
(1) |
Band-rejecting at frequency f0 = 50Hz requires transfer zeros in the form
|
(2) |
Then the design formula for coefficient a1 is as follows:
|
|
(3) |
Substituting the numerical values of f0 = 50Hz and fs = 11025Hz into (3) yields the value of coefficient a1
a1 = -1.9991880801438362.
The absolute value of b2 in the denominator of transfer function (1) is equal to the absolute value of complex conjugate filter poles. Increasing this number towards 1 means an analogy to increasing the quality factor of continuous-time 2nd-order filter towards infinity. A very high quality factor implies - among other things - high sensitivity of the frequency response to coefficient quantization. For the filter in Fig. 9, the trade-off value
b2 = -0.9
is chosen. Since a band-reject filter is concerned here, unity gain at the frequency 0Hz is required, thus K(z) = 1 for z = 1. From Eq. (1) we can derive the design formula for coefficient b1
 |
(4) |
After substituting the already designed coefficients we get
b1 = 1.8991880801438361.
As shown in Fig. 9, equations (3) and (4) for the design of a1 and b1 are directly programmed into the schematic editor by means of .define statements. On the right, the computed values are displayed. This is accomplished by inserting the so-called „formula text“. For instance, for displaying the value of a1, the formula text is simply
=a1
Now if you modify the values of variables fs, f0, or b2, which affect coefficients a1 and b1, the changes are immediately reflected in the drawing area.
A user function which is defined on the drawing area is trun. This function of two variables, a and N, returns a value that is equal to the decimal equivalent of a coefficient on the assumption that a is in two's complement form after quantization to N bits on the right of decimal point. The number of bits is defined by another .define statement to 16. The trun function is defined in such a way that it performs quantization exactly according to the same algorithm, which is implemented in the „Filter Design Toolbox“ in MATLAB. For N = 0, the quantization is not active. In addition to the functions if and sgn, well known from PSPICE, trun also utilizes special Micro-Cap function mod (remainder after integer division).
While defining the user function, we can replace the .define statement by the well-known PSPICE command .func. However, we do not recommend it when in the body of the function are structures which do not use PSPICE syntax (the mod function in this case).
As shown in Fig. 9, programming the coefficient quantization by means of the trun function is easy. The quantized coefficients are available in variables qa1, qb1, and qb2. Their values are directly displayed on the drawing area via „formula texts“.
To support filter design, equation (3) for computing the frequency f0 is also programmed. The qa1 coefficient, i.e. after quantization, is used in this formula. On the right, the real rejecting frequency is displayed, which due to quantization is modified compared to the design value 50Hz. After changing the number of bits, N, e.g. to 10, one can immediately find that the rejecting frequency is changed to 38.77Hz. Note that the sensitivity to coefficient quantization is considerable.
Because number of bits, N, is defined as a symbolic variable, we can step it within all basic analyses. Fig. 10 shows frequency responses without coefficient quantization (N = 0, rejecting frequency is 50Hz, maximum attenuation), and with the quantization to 16, 13, and 10 bits (rejecting frequency is decreased, attenuation is not so perfect). This analysis results in the necessity to quantize the coefficients to at least 16 bits.

Fig. 10. Detail of frequency response of the filter from Fig. 9 for filter coefficients without quantization and with quantization to 16, 13, and 10 bits after decimal point.
Note that for the sake of lucidity, the .define and formula texts, either all or only the selected ones, can be moved from the drawing area to the so-called text folder. The subsequently saved circuit file will contain all the data as defined by the user.
Another useful data structure, implemented in Micro-Cap, is the array structure. It is defined by the .ARRAY statement. The name of array and a set of numbers separated by commas follow. The individual terms in the array are accessible by addressing simply
array_name(i)
where i is an integer from 0 to array_length-1.
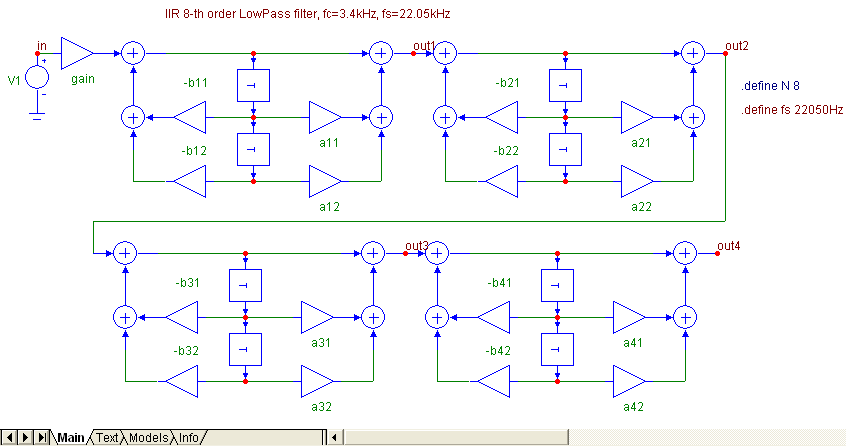
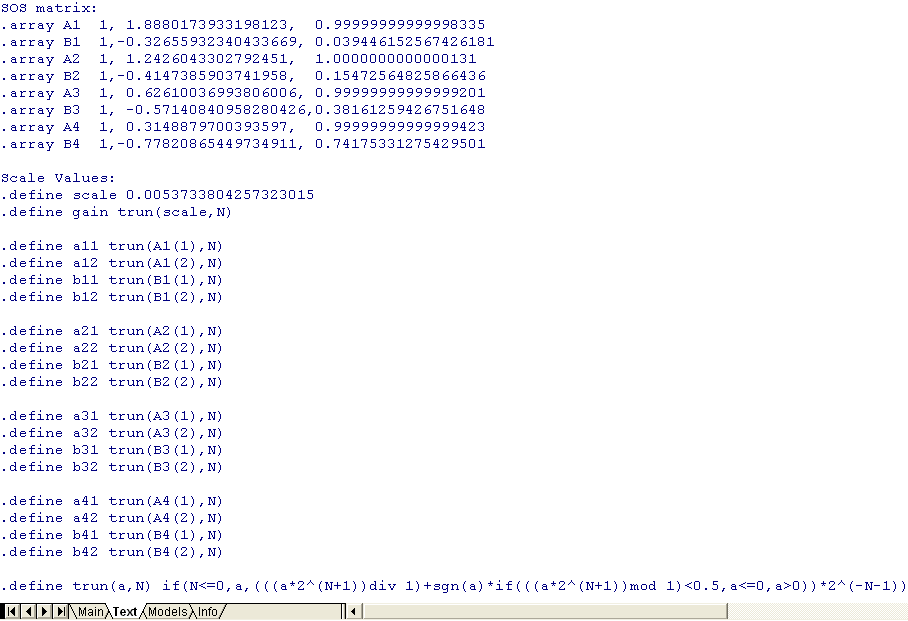
Arrays can be advantageously used to store filter coefficients, especially for high-order filters. A demonstration is given in the LP8.CIR file. The drawing area is shown in Fig. 11a. The text area is in Fig. 11b.
 (a)
(a)
 (b)
(b)
Fig. 11. (a) 8th-order cascade filter, (b) definition of its coefficients by arrays of type A (numerator) and B (denominator) in the „Text“ folder.
The filter coefficients are defined in the „Text“ folder. The data format in this folder is pure text. This fact facilitates data handling. The coefficients of individual sections were imported into this folder via clipboard from MATLAB. Then they were included in arrays A1 to B4. Quantized coefficients are obtained by means of the trun function.
Running the AC analysis, one can see that frequency response is very little sensitive to coefficient quantization. The low sensitivity results from the low values of quality factors of individual second-order sections. The amplitude frequency response for 8-bit quantization is shown in Fig. 12. Next figure below illustrates how the impulse response is analyzed by the inverse Fourier transform of frequency response in the frequency range (theoretically) from 0 Hz do fs.

Fig. 12. Amplitude frequency response of the cascade filter from Fig 11a and its impulse response. Filter coefficients are quantized to 8 bits.
The "input-to-cascade" filter responses, analyzed from the input to the outputs of cascade sections, are in Fig. 13. It is obvious that scaling is necessary to optimize filter dynamic range, i.e. to rearrange the total filter gain among the sections by modifying the coefficients of numerators of transfer functions of subblocks in the cascade. The frequency responses in Fig 13 can be an excellent starting point for such optimization [4].

Fig. 13. Frequency responses of the filter from Fig. 11a, measured from the input to the outputs of individual 2nd-order sections.
6 Analysis of quantization noise propagating to the filter output
Regarding the quantization effects, in addition to coefficient quantization, the ratio of powers of output and input noises is frequently analyzed. Denote this ratio as NNR (Noise to Noise Ratio). It is useful to differentiate between two kinds of sources of quantization noise: noise at the filter input, generated by analog-to-digital converter, and quantization noise due to multiplying the digital filter signals and filter coefficients. In the first case, the complete filter is placed between the noise source and the output. In the latter, the transfer path of noise starts at the output of the appropriate multiplier and leads to the filter output.
However, the methodology of NNR computation is identical in both cases. In the first step, we find the transfer function K(z) between the source of the noise and the filter output. Then the NNR is evaluated by means of the formula [4]
 |
(5) |
The symbol L represents a curve of integration, specified as a circle of unity radius, centered in the origin of the z-domain complex plane. According to the residue theorem [5], the right-side sum represents the sum of residua of complex function within the braces {} in the poles of this function, which are located inside the curve of integration.
As proven in [6], for Mth-order digital FIR filter, the NNR is equal to the sum of squares of its coefficients hi:
 |
(6) |
In the case of IIR filters, the computation of NNR according to (5) can be complicated. In such cases, we can use another method, which starts from the frequency response of the transfer path between the source of noise and the filter output:
 |
(7) |
The frequency response can be easily obtained by AC analysis. After that, the simulation program must compute the mean square of the absolute value of frequency response within the frequency region from 0 to fs/2 or from 0 to fs, if appropriate.
An economical realization structure of a 15th-order linear-phase FIR filter is in Fig. 14. The corresponding model is in the BP15.CIR circuit file. The filter has 16 "symmetrical" coefficients. In Fig. 14, half of them are implemented.

Fig. 14. 15th-order bandpass FIR filter.
The filter coefficients are defined separately in the „Text“ folder as follows:
|
.array a + 0.011932832718619923, + 0.0043636441772756003, +-0.0081892506039719284, + 0.073487283106366652, + 0.027003232751724886, +-0.21586100424115826, +-0.14953110748229956, + 0.26565882334944552 |
The + character at the beginning of the row denotes the same as in PSPICE, i.e. a link to previous row.
Formula (3) is implemented directly on the drawing area by the following statement:
.define NNR 2*series(m,0,7,a(m)^2)
Micro-Cap internal function „series“ finds the sum of the series whose m-th term is a(m)^2. The integer m increases from the starting value 0 to the final value 7. Such procedure yields one half of the sum (6), which must therefore be multiplied by two. Approximately 29 percent of the power of quantization noise from the input will appear at the output.
Fig. 15 summarizes the results of AC analysis in the frequency range up to one half of the sampling frequency. The bottom curve illustrates the running average (represented by the „avg“ function) of the absolute value of the square of frequency response. According to (7), its value for the frequency fs/2 should be equal to the NNR. A good agreement with the above result is apparent from Fig. 15.

Fig. 15. AC analysis of the filter from Fig. 14.
The method described is general, enabling a fast determination of NNR from an arbitrary node of the realization structure to the filter output.
The „series“ function can be useful in the analysis of large filters, for example FIR filters of the order of hundreds and more, when drawing the realization structures would be tedious and impractical. The BP421.CIR sample file contains a model of an FIR linear-phase digital filter of the order of 421. The filter is specified as a bandpass 1k-2kHz filter with 0.1dB passband ripple and with 96dB attenuation below 900Hz and above 1100Hz.
This filter has been designed in MATLAB by means of the FDATOOL. For such large filters, MATLAB generates only the coefficients in direct realization form. Exporting these coefficients into Micro-Cap can be preferably solved as follows (the above description is related to Signal Processing Toolbox 6.5):
In the FDATOOL window let us select the Targets/Generate C header.. , keeping the preset format of exported data “Double-Precision Floating-Point”. Then we click on the Generate icon and save the coefficients into a file with extension h.
Then we copy - via the clipboard - the filter coefficients from the file into Excel, specifically into the 2nd column. We fill the first column with + characters. After that, we copy both columns - again via the clipboard - into the Micro-Cap „Text“ folder. We complete the row with
.array num
above the copied data.
The schematic part of the filter model is in Fig. 16.

Fig. 16. Smart modeling of 421st-order filter by means of a single „Laplace“ source, including the possibility of coefficient quantization.
The filter is modeled by the „Laplace“ source, whose transfer K is programmed as the series

where qnum denotes the quantized coefficients from the array num. The quantization is performed by the trun user function, which is also defined in the text folder.
A little easier modeling of the transfer function could be performed by the Micro-Cap „Z-source" of the type of ZVofV. However, the contemporary version of Micro-Cap 8 does not support the definition of its transfer by means of the internal function series.
Modeling the NNR is also implemented on the drawing area. For coefficients without quantization, its value is quite small (0.191). This is due to narrowband filtering. Results of filter AC analysis are in Fig. 17. For the sake of detailed depiction of amplitude frequency response, a relatively small computation step has been chosen. By stepping the number of bits, N, one can check that to maintain a broadband attenuation of 96 dB in all the stopband region, it is necessary to quantize filter coefficients to at least 21 bits.

Fig. 17. Frequency response of the filter from Fig. 16.
7 Other possibilities of analysis
Micro-Cap includes several functions which can be useful in increasing the user's convenience in analysis not only digital filters. Let us mention some of them.
PROD(m,a,b,z(m))
… product in the form
![]()
It is an analogy of the SERIES function. For example, PROD can be used to define the filter transfer functions from zeros and poles by means of products of root factors.
DELAY(x,d)
…delays the signal x by d seconds.
When we use this function to define the transfer of a Micro-Cap function source, e.g. a source of the type of NFV, we can model the delay block for efficient transient analysis. In addition, the function source has an attribute FREQ, which enables separate modeling of its behavior for AC analysis. We can use that idea for universal modeling of delay blocks.
.WARNING
… a command that lets you define warning messages that appear on the drawing area if some condition is true. The condition is a boolean expression which is specified by this command, together with the text of the warning message.
For our purposes, we can use this command for watching the comparatively large modifications of filter coefficients due to quantization, for generating reports about filter instability, etc.
The above facilities of digital filter analyses via the SPICE-family programs have been verified for many simulation problems. The Micro-Cap program, starting with version 8, turned out to be an excellent tool for user-friendly and comfortable analysis, including the modeling of quantization effects. Only two things are necessary for instant working with the new "mini-library" of models for digital filter analysis: 1 copying three files with macros into Micro-Cap folder LIBRARY, and 2 reading some of the sample circuit files into the schematic editor. The evaluation version of Micro-Cap is available on the Internet [2]. Compared to the Micro-Cap professional version, the program designers generously locked up only a few features. It is possible to analyze circuits up to 50 components and 100 circuit equations. All the demonstrations in this paper were implemented in the evaluation version of Micro-Cap 8. By means of the modeling technique described in Chapter 6 we can analyze filters without fundamental limitations of their order.
A set of files containing macros and sample circuit files from this paper can be downloaded here.
More details about the practical utilization of the Micro-Cap program are described in the book [3].
|
OrCadPSpice homepage: http://www.orcad.com/ |
|
|
Micro-Cap homepage: http://www.spectrum-soft.com |
|
|
Biolek, D. Solving electronic circuits. The book about their analysis (in Czech). BEN, Technická literatura, 2004, http://shop.ben.cz/default.asp?kam=detail.asp?id=121177. |
|
|
Ahmed, N., Natarajan, T. Discrete time Signals and Systems. Reston, Prentice Hall, 1983. |
|
| [5] | Cauchy integral theorem and residue theorem: http://en.wikipedia.org/wiki/Residue_theorem |
|
Abuetwirat, I.F. Finite Impulse Response Filter. Diploma work, Inst. of Microelectronics, BUT, 2006. |