
ABSTRACT
On Saturday 24th April 1993, a bombing incident took place at
approximately 10:25 a.m. within the Bishopsgate area of the city of
London. As a result, one person was killed and 34 people were injured.
Damage to building structures, fabric and contents, within a radius of
about 500 m of the device ranged from total devastation to minor damage.
As a consequence of this incident, the author was involved, as a
consultant to Griffiths Cleator and Associates (GCA), in the reinstatement
of over ten commercial buildings of various sizes, construction and
degrees of damage. Finite Element Analysis was carried out on two of these
buildings using ANSYS. A non-linear transient dynamic analysis was
performed on a 3-D model of a typical floor of the first building, and a
quasi-static analysis was performed on a full 3-D model of the second
building. This paper presents a brief overview of the bombing incident and
its damaging effects on building structures, outlines the investigation
and testing techniques used, discusses both types of FE analyses employed,
presents the dynamic response of the two buildings as predicted by FEA,
correlates the analysis results with the investigation and testing that
was carried out on site, and discusses the reliability of using FEA in
highlighting problematic zones in the structure.
INTRODUCTION
At approximately 10:25 on Saturday morning, 24th April 1993, a
terrorist bomb exploded in city of London. The device which was made of
unknown quantity of home-made explosives was carried in the back of a
vehicle that was parked on the Bishopsgate southbound carriageway in the
position shown in Fig.1. One person was killed and approximately 34 people
were injured. Building structures, fabric and contents, within
approximately 500 m radius of the device exhibited different degrees of
damage with the maximum being close to the bomb. |
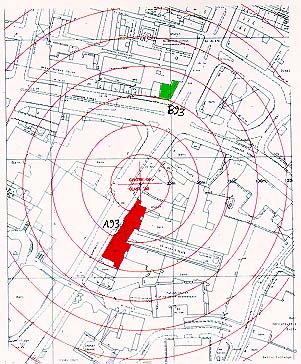
| FIGURE 1 |
| LOCATION PLAN OF THE SOURCE OF
DETONATION AND THE TWO BUILDINGS; BUILDING A93 MARKED IN RED;
BUILDING B93 MARKED IN GREEN. |
The 14th century St Ethelburga's Church, which was only about 7 m away
from the bomb, was practically levelled to the ground. The size of the
bomb was estimated to be approximately 850 kg TNT equivalent. This
estimation was based on specialist forensic evidence and study of the
crater measurements and the soil properties.
As a consultant to Griffiths Cleator and Associates (GCA) at the
time, the author was involved in the investigation and reinstatement of
over ten commercial multi-storey buildings with the closest being 11 m
from the bomb. |
|
For the
purpose of this paper the number of buildings discussed shall be limited
to the ones modelled and analysed by FEA using ANSYS and they will be
referred to as A93 (marked in red in Fig.1) and B93 (marked in green in
Fig.1). The proximity of these two buildings to the source of detonation
is 11 m and 75 m respectively.
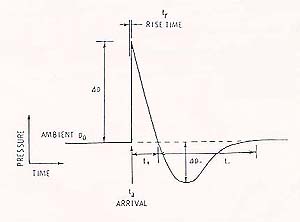
| FIGURE 2 |
| TYPICAL EXPLOSION WAVE PRESSURE
- TIME GRAPH. |
Royal Ordnance, being a division of British Aerospace Defence
Limited, was appointed to provide information on the magnitudes of the
blast pressures experienced by the two buildings, externally and
internally, in the form of time-history graphs at specific points of each
structure using 3-D simulation packages named 'INBLAST' and 'CHAMBER'.
This paper investigates the dynamic response of the two buildings as
observed on site on one hand and as predicted by FEA on the other hand. It
correlates the analysis results with the investigation and testing
findings, and discusses the reliability of FEA as a tool not only for
predicting the response but also in highlighting problematic zones that
may not be easy to observe on site without major opening up and breakage
of the structure. |
2. CHARACTERISTICS OF BOMB
BLAST
An explosion is an instantaneous conversion of a small volume of
solid, or liquid, into a large and highly pressurised volume of very hot
gases that undergo violent expansion. As a result, a blast wave is
formed by the rapidly moving compressed air which is characterised by an
instantaneous rise in pressure. This is followed by a decay over a period
called the positive phase duration (see Fig.2). As the energy of
the expanding gases becomes dissipated, their momentum falls and they
begin to contract, creating a suction phase known as the negative
phase. At this phase, the blast wave pressure is below ambient
(atmospheric) pressure.
If the explosion is contained by soil at a considerable depth
from the ground surface, the energy will be converted into vibrations that
propagate through the ground as seismic waves. At lesser depths, as is the
case here, smaller proportions of the energy will be transmitted as
seismic waves and much of the explosive force will be absorbed by the
earth close to the surface displacing it and forming a crater (see
Plate-1).
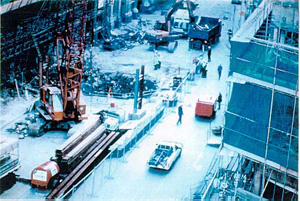
| PLATE 1 |
| CRATER FORMED BY THE EXPLOSION
OF THE BOMB (DIAMETER = 9M; DEPTH =
2.5M). | |
|
As the blast waves radiate out within the confined city streets
they will be reflected and refracted by adjacent buildings. The blast
waves will travel over the tops of buildings and down light wells thus
totally enveloping these buildings and subjecting them to large unbalanced
transient blast loads such as pressure pulses, gas filling and linear
windage all of which have different times of arrivals. The geometry of the
individual buildings, and in particular their elevations, can further
magnify the incident transient blast loads.
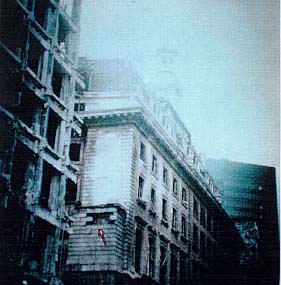
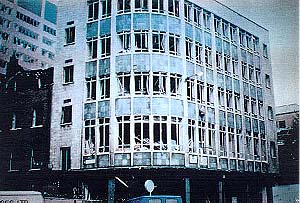
| PLATE 2 |
| BUILDING A 93. (NOTE THE
DAMAGE INDICATED BY THE RED ARROW). |
The blast loads, although being transient in nature, would
nevertheless have been many orders of magnitude greater than the original
structural design loads for the buildings within the affected zone. Due to
the random nature of blast loads, damage to building structures is
notoriously unpredictable. Depending on the location of the explosive
device, the configuration of the surroundings and the quantity of free
space into which the gas may expand, the effects of a given explosive
device on a structure are notoriously unpredictable.
|
3. DESCRIPTION OF THE TWO
BUILDINGS
3.1 Building
A93
This was a grade II listed steel framed building, 7 storey high
constructed in 1928 (see Plate-2). Its architectural form can be described
as stone classical facade. Above 5th floor, the elevation steps inwards
and extends up the 7th floor where it was crowned with a cornice. Above
this was a steep slated mansard roof with dormer windows. The structural
frame was made up of plated mild steel R.S.J's (Beams and columns) or made
up plated beams secured with rivets and either riveted or bolted end
connections. The floors plates were generally insitu reinforced ribbed
slabs with permanent hollow tile liners used as shuttering. Part of the
3rd floor slab which was a later adaption was infilled using a timber
joist floor supported on steel beams.
The internal columns were encased with 100 mm terracotta hollow
blocks, the external columns were buried within the masonry and the
internal downstand beams were concrete cased. At 1st and 2nd floors
vertical continuity of some columns was interrupted and these were
supported off substantial plated transfer beams which spanned 10 meters
and were approximately 1 meter deep. The column point loads on these beams
were approximately 1500 kN each. Transfer beams also occurred at 6th floor
to cater for the step back in the elevation.
The basement and lower ground floor extended out under the
Bishopsgate pavement and at the north west corner of the building the
reinforced concrete basement retaining wall bounded the perimeter of the
bomb crater. It was established from preliminary site investigations and
inspection of archival details that the entire basement had an external
asphalt membrane applied prior to casting the sub-structure concrete.
3.2 Building
B93
This property was constructed sometime between the late 1950's
and early 1960's. The building had a basement, ground and five upper
floors (see Plate-3). |
|
Its construction consisted of a concrete cases structural steel frame
supporting hollow tiles reinforced concrete floor slabs. At 5th floor the
elevation stepped back and the perimeter cavity brickwork wall provided
support to the high level 5th floor roof.
The enclosure to the basement was a combination of reinforced
concrete retaining walls and a solid masonry party wall. The infill apron
panels were faced with slate which were faced fixed to backing brickwork
and downstand concrete beams. The parapet walls and staircase enclosures
had stone panels similarly fixed. The beam column connections consisted of
riveted seating cleats and site bolting of the beams to the cleats. Only
in some locations were the top flange restrained with a cleat. Vertical
stability was achieved through lift/staircase and flank walls.
4. DAMAGE
INVESTIGATION AND TESTING
Immediately following the city bombing all efforts were
naturally directed at damage limitation measures. The general condition of
the fabric was recorded, photographed and videoed prior to it being
removed, as this may give important clues on both the blast wave pressures
and the manner in which they propagated through the structure. The
preliminary bomb damage assessment report included a program of
recommendations for further detailed inspections, opening up works and
testing required to assess fully the effects of the blast on the
structure. |
Where
visual evidence of distortions, deflections, and cracking to the structure
and its finishes existed, selective local opening up of these elements
were undertaken to establish if failure have occurred.
Having identified the areas of structure for detailed
investigation, a regime of site and laboratory testing was prepared,
starting from locations of greatest visible blast damage. Analytical
methods proved very valuable here in terms of indicating areas of
possible serious overstressing of the structure. Given the
unpredictability of blast effects on buildings, it was found to be more
cost and time effective to implement methods, such as finite element
analysis that may highlight areas of damage prior to undertaking
extensive opening of the structure.
Static proof load testswere carried out on floor panels
which sustained maximum physical damage to compare actual
deflections with analysis predictions. These results were compared
with the results from a control area selected on the basis of least visual
damage and similarly for all other materials tested. Also, plumb line
surveys were carried out on the external elevations of both buildings,
and FE analysis results were compared with recorded lateral displacements
of the elevations of building B93.
5. BLAST
OVERPRESSURE EXPERIENCED BY THE TWO BUILDINGS
What needs to be estimated first, is the magnitude of the
blast pressures that the building may have experienced so that, FE
technique, for example, can be used to obtain an indication of the
dynamic response of the structure prior to it coming to rest. The
consequences of this response on the structural integrity of the building
can hence be evaluated. Royal Ordnance (a division of British Aerospace
Defence Limited) were appointed to provide information on the magnitudes
of the blast pressures experienced by the two buildings both on their
external elevations and inside each structure through gas filling. Two
distinct elements of calculations were carried out. The first, was to
perform detailed external shock reflection modelling using INBLAST. For
this analysis, 82 external test points on the elevations of building A93,
and 88 external test points on the elevations of building B93 were
selected by the author. |
|
The second element of the calculation, was the analysis of the
blast wave ingress into the structure and loads on internal slabs. This
assessment used a program named CHAMBER which assesses the internal
reflection and diffraction of blast waves entering through openings. For
this analysis, 6 internal test points on a typical floor of building A93,
and 5 internal test points on a typical floor of building B93 were
selected.
5.1 Building
A93
Bomb blast pressures are transient in nature and frequently of short
duration. On this building, this duration did not exceed 350 ms. The
maximum peak positive pressures ranged from 1,365 kN/m2 on the
north corner of the building (close to the bomb), to 91 kN/m2
on the south corner (away from the bomb). The arrival times of these
pressures were 12 m.sec and 138 m.sec respectively. In order to appreciate
the magnitudes of these pressures, it is worth pointing out that buildings
in the London region, including this one, are designed usually for a
maximum wind pressure of 1.5 kN/m2.
With regard to the internal pressures, their arrival times were
similar to the external pressures and their peak positive pressures ranged
from 490 kN/m2 north to 126 kN/m2 south of the
building. Careful examination of these pressures at various time intervals
concluded that these pressures subjected the floor plates to highly
complex transient behaviour in both upward and downward direction
occurring simultaneously on individual floor panels and far exceeded the
original design loads of 10 kN/m2. |
5.2 Building
B93
All points on the rounded corner of the building between Bishopsgate
and Wormwood Street have seen very high blast pressures that reached a
maximum value of 131 kN/m2 at first floor level. The reason
being that this corner was approximately normal to the shock waves. This
is also 87 times the wind load that the building was designed for in the
laterally. At ground floor level, however, these pressures were less than
those at 1st floor level. This can be attributed to the frictional effects
of the ground on the shock waves.
The internal pressures on the test points at ground floor level
were significantly higher than those on the corresponding test points at
1st floor level. This is attributed in this case to the large vent sizes
of the shop windows at ground floor level. The values of the internal
pressures on the ground floor ranged between 118 kN/m2 and 167
kN/m2. This can be appreciated again when compared with the
original design load on floors of 4-5 kN/m2. The internal
pressures duration was approximately 200 m.sec.
It is important to note the difference in the arrival time of
the blast pressures to the two building from the time of explosion of the
bomb (15 m.sec to the external elevation of building A93, compared to 140
m.sec when it hit the external elevation of building B93; a time lag of
125 m.sec). |
|
6. FINITE ELEMENT
MODELLING AND ANALYSIS
6.1
General
In the analysis of the dynamic response of a building structure
to bomb blast, the following procedures must be followed [Esper &
Keane, 1995]:
- The characteristics of the blast wave must be
determined (as explained above).
- The natural period of response of the structure (or
the structural element) must be determined.
- The positive phase duration of the blast wave is
then compared with the natural period of response of the
structure.
Based on (3) above, the response of the structure is
then defined as follows:
- If the positive phase duration of the pulse is shorter than the
natural period of vibration of the structure, the response is described
as impulsive. In this case, most of the deformation of the structure
will occur after the blast loading has diminished.
- If the positive phase duration of the pulse is longer than the
natural period of vibration of the structure, the response is defined as
quasi-static. In this case, the blast will cause the structure to deform
whilst the loading is still being applied.
- If the positive phase duration of the pulse is close to the natural
period of vibration of the structure, then the response of the structure
is referred to as being dynamic. In this case, the deformation of the
structure is a function of time and the response is determined by
solving the equation of motion of the structural
system.
|
6.2 Building
A93
The fifth floor slab of this building was modelled using ANSYS.
Two element types were used; shell element (shell 63) for the reinforced
concrete slab, and beam element (beam 4) for the steel beams. The total
number of elements in the model was 945, and the total number of nodes was
627. Each node had 6 DOF; three translations Ux, Uy, Uz, and three
rotations qx, qy, qz. The column locations were considered as support
points for the slab. Material properties of concrete and steel were
incorporated based on actual testing of the concrete cores and
examinations of the steel materials of the beams. The values used in the
analysis were as follows:
For steel:
Ex= 205 kN/mm2
n =
0.3
Dens = 7800 kg/m3
and for concrete:
Ex= 25 kN/mm2
n =
0.2
Dens = 2400 kg/m3
By carrying out a modal analysis first, using ANSYS, the natural
frequencies for the first three modes of the floor plate of building A93
were given as follows:
f1= 12.495 Hz
f2=
13.459 Hz
f3= 13.490 Hz |
|
The
fundamental period of the plate was hence calculated and found to be equal
to:
T1 = 1 / f1 = 0.080 sec = 80 msec
The positive phase duration was found on the internal
pressures-time history graphs to be ranging between 20-45 m.sec. Since
this was shorter than the fundamental period of the floor plate, a 3-D
non-linear transient dynamic analysis was, then carried out in order to
determine the response of the floor slab to the internal pressures.
The blast pressures were applied on the top and bottom faces of
the concrete floor as pressure-time history graphs as produced by Royal
Ordnance. Consequently, two graphs for every node of the model were
obtained, one representing the deflections due to the pressures acting on
the bottom face of the slab, and the other representing the deflection of
the floor slab due to pressures acting on the top face of the slab. The
two graphs were superimposed over each other so that the actual net
deflection at any time can be estimated. As an example node 124 is
considered and located near the middle of the bay next to the North
stairs. It can be seen that the floor slab, at this point, was lifted
upward by 16 mm before the pressures acting at the top of the slab were
able to start pushing it downward. |
It has been demonstrated by the FE analysis that when the soffit
of the floor plate saw a positive peak pressure, it took 10 msec on
average to develop its maximum deflection which ranged between 16 mm and
24 mm. It was observed that a 5 msec time lag in the pressures hitting the
top surface of the slab was sufficient to result in a net upward
deflection of approximately 16 mm above the horizontal. This momentary
uplift of the plates will result in tension cracks to the top surface of
the structural topping. This is combined with the subsequent rebound of
the plate will cause crack aggravation over the supports, thus impairing
the performance of the bond between the concrete and its reinforcement.
This would result in failures similar to those that were recorded on
the 5th floor load test, i.e. slippage of the reinforcement over the
supports.
Further corroboration of these pressures, is the damage observed
to the slab soffits which included cracking along the joints between the
asbestos pots, hairline cracking of the concrete between the structural
topping and the ribs. This cracking was reported in the petrographic tests
of the cores that were taken from the structural slab. |
|
6.3 Building
B93
A full 3-D FE model of this building was generated using ANSYS. Two
element types were used here too; shell element (shell 63) for the
reinforced concrete slabs, and beam element (beam 4) for the steel beams
and columns. The total number of elements in the model was 5232, and the
total number of nodes was 3912. Each node had 6 DOF; three translations
Ux, Uy, Uz, and three rotations qx, qy, qz. From Plate-3, it can be seen
that this building has a large window area in each floor all the way
around except on the west elevation (flank wall). Taking also into account
the fact that it was reported by various sources [Royal Ordnance, 1993 and
later by Mayes & Smith, 1995] that normal glass, as a brittle
material, takes only 5-8 msec to break, it was found obviously sensible
not to include the glass panels in the FE analysis. This is true as long
as the glass panels are weak enough not to transfer any load to the
structural elements (such as frame members).
Material properties of concrete and steel were incorporated
based on actual testing of the concrete cores and examinations of the
steel materials of the beams. The values used in the analysis were as
follows:
| For steel: |
For concrete: |
Ex = 205
kN/mm2
n = 0.3
Dens = 7800 kg/m3
|
Ex= 24
kN/mm2
n = 0.2
Dens = 2400 kg/m3
| |
By carrying out a modal analysis first, using
ANSYS, the natural frequencies for the building were given as follows:
f1= 1.899 Hz
f2=
1.961 Hz
f3= 2.586 Hz
The fundamental period of the plate was hence
calculated and found to be equal to:
T1 = 1 / f1 = 0.527 sec = 527 msec
The positive phase duration was found on the internal
pressures-time history graphs to be ranging between 50-80 m.sec. Since
this was shorter than the fundamental period of the floor plate, the
response of the building was impulsive, and the proper analysis that would
be used is a non-linear transient dynamic one. Since the main concern was
concentrated on the actual stability of the building, a quasi-static
analysis was carried out as follows: The blast pressures were applied at
different time intervals as a static load that has a variable value
throughout all the elements forming the facades of the building. These
values were extracted from the pressure-time history graphs produced by
Royal Ordnance at each specific time interval considered in the analysis.
This has allowed one to look at the maximum deflection that could have
been experienced by the building with considerable saving of computer time
and analysis efforts (such as feeding all the pressure-time history graphs
to all the locations of the selected external 80 test points on all the
elevations of the building). |
|
7. CORRELATION BETWEEN
DAMAGE AND FEA RESULTS
Tremendous damage was observed in the Bishopsgate incident. In
buildings close to the explosion, floor slabs were momentarily lifted,
load bearing walls moved and became out of plumb, and hidden damage
resulted. Hidden damage in building structures due to dynamic loading
became of more concern to engineers particularly after the investigation
of damaged buildings following the Northridge earthquake [NCE, 1994] and
the Kobe earthquake [Esper & Tachibana, 1995] where the same types of
damage described above were found.
In the case of this explosion, building A93 exhibited damage in
the form of cracking, high speed spalling and scabbing of concrete cover,
shear and/or tensile failure of columns, upward failure of floors,
snapping of rods and prying of frame connections. The main feature of this
damage was the cracking in the concrete floors and failure under load
testing. This was predicted also in the FE analysis. Location of cracking
zones were highlighted in the FE analysis and these fine cracks were found
as predicted by the FEA when the preliminary inspection / investigation
did not report them. This was particularly important when these cracks
were discovered in the mezzanine floor (2nd floor) where timber joists
exhibited longitudinal fine cracks that were difficult to observe in the
preliminary investigation. |
In the case of Building B93, less damage was observed to the
floor slabs because it was located much further than building A93 relative
to the bomb. However, what was of a major concern in this building is the
effect of the blast on the stability of the building and its residual
strength to carry the original design load. This urged the need to look at
the global behaviour of the structure and the magnitudes of permanent
deflections in all three direction that may have resulted in the
structure. Plumb survey was carried on the structure, along with all the
other specified regular tests. Finite Element results from the 3-D
quasi-static analysis over different time steps of the load showed good
correlation with both the deformed shape and displacement magnitudes of
the structure at corresponding points. Maximum deflection of 25 mm that
was observed in the plumb survey on line V7, for instance, had a
displacement value in the same direction of 22 mm in the FE analysis.
Although these magnitudes may not seem particularly significant, design
check calculations were carried out in order to predict the additional
forces and moments values induced, in the structural frame, by the new
displacements, and the adequacy of the frame to carry these forces and
moments. Additional bracing was needed in this case for the structure to
carry on functioning in the manner it was originally designed for.
|
|
8. CONCLUSIONS
Given the unpredictability of blast effects on buildings, it was found
to be more cost and time effective to implement methods, such as finite
element analysis that may highlight areas of damage prior to
undertaking extensive opening of the structure.
This was the case in both building A93 and building B93. In the
former, the scope of testing was greatly reduced in terms of opening up of
beam-column connections and directed the next investigation / testing
stage in a manner that was more efficient and economic. Decisions made
later regarding future use of different parts of the structure (e.g. floor
slabs, steel frame, etc.) carried great confidence particularly that they
were backed up by site testing results.
Although the response of building B93 was transient, but
considering the type of concern encountered here (i.e. stability of the
structure and the magnitudes of the displacements associated with it), it
proved to be very cost effective to carry out a quasi-static analysis
particularly when taking into account the size of the structure modelled
here, and the efforts involved in terms of feeding all the necessary
information to carry a non-linear transient dynamic analysis. The other
advantage is obviously the saving in computer time necessary to carry out
the non-linear transient analysis. Once more, and being more important
here, the combined analysis and testing carried out hand in hand proved to
be very efficient in reducing the scope of carrying either of them
separately, and having at the same time more confidence in the results, in
addition to achieving the best economic solution. |
ACKNOWLEDGEMENTS
The author gratefully acknowledges the valuable contribution
made by William Keane of Griffiths Cleator & Associates. The author
also wishes to express his appreciation for the support provided by
Griffiths Cleator and Associates, University of Westminster, and Taylor
Woodrow Construction Holdings Limited. Finally, the support provided by
the help desk and other members of the STRUCOM company on ANSYS is greatly
appreciated.
REFERENCES
Esper, P., and Keane, W., The St Mary Axe /
Bishopsgate Experiences on the Dynamic Response of Buildings to Bomb
Blast, A paper presented and discussed at the Institution of
Structural Engineers, Thames Valley Branch, on Wednesday 4th October 1995
at 6 p.m., London, UK.
Esper, P., and Tachibana, E.,
The lesson of Kobe Earthquake, Geohazards and Engineering Geology
Conference, Coventry, 1995.
Mayes, G. C., and P. D. Smith,
Blast Effects on Buildings, London, 1995.
New Civil Engineer (NCE), 29th
September 1994 edition, London, UK.
Royal Ordnance, Report on the
Analysis of the Effects of the Bishopsgate Bombing on Hasilwood House,
Swindon, 1993. |
|